Install Prometheus and Grafana On the new Server
Create a system user or
system account, run the following command:
sudo useradd \
    --system \
    --no-create-home \
    --shell /bin/false prometheus
Download Prometheus.
wget https://github.com/prometheus/prometheus/releases/download/v2.47.1/prometheus-2.47.1.linux-amd64.tar.gz
Extract all Prometheus files from the archive.
tar -xvf prometheus-2.47.1.linux-amd64.tar.gz
Also, you need a folder for Prometheus configuration files.
sudo mkdir -p /data /etc/prometheus
Now, let’s change the directory to Prometheus and move some
files.
cd prometheus-2.47.1.linux-amd64/
let’s move the Prometheus binary and a promtool to the /usr/local/bin/. promtool is used to check
configuration files and Prometheus rules.
sudo mv prometheus promtool /usr/local/bin/
Optionally, we can move console libraries to the Prometheus
configuration directory.
sudo mv consoles/ console_libraries/ /etc/prometheus/
Finally, let’s move the example of the main Prometheus
configuration file.
sudo mv prometheus.yml /etc/prometheus/prometheus.yml
To avoid permission issues, you need to set the correct
ownership for the /etc/prometheus/ and data directory.
sudo chown -R prometheus:prometheus /etc/prometheus/ /data/
You can delete the archive and a Prometheus folder when you
are done.
cd
rm -rf prometheus-2.47.1.linux-amd64.tar.gz
Verify that you can execute the Prometheus binary by running
the following command:
prometheus --version
We’re going to use Systemd, which is a system and service manager for Linux operating systems. For
that, we need to create a Systemd unit configuration file.
sudo vim /etc/systemd/system/prometheus.service
Prometheus.service
[Unit]
Description=Prometheus
Wants=network-online.target
After=network-online.target
StartLimitIntervalSec=500
StartLimitBurst=5

[Service]
User=prometheus
Group=prometheus
Type=simple
Restart=on-failure
RestartSec=5s
ExecStart=/usr/local/bin/prometheus \
  --config.file=/etc/prometheus/prometheus.yml \
  --storage.tsdb.path=/data \
  --web.console.templates=/etc/prometheus/consoles \
  --web.console.libraries=/etc/prometheus/console_libraries \
  --web.listen-address=0.0.0.0:9090 \
  --web.enable-lifecycle

[Install]
WantedBy=multi-user.target
To automatically start the Prometheus after reboot, run enable.
sudo systemctl enable prometheus
Then just start the Prometheus.
sudo systemctl start prometheus
To check the status of Prometheus run the following command:
sudo systemctl status prometheus
Now we can try to access it via the browser. I’m going to be
using the IP address of the Ubuntu server. You need to append port 9090 to the
IP.
<public-ip:9090>
Install
Node Exporter on Ubuntu 22.04
Next, we’re going to
set up and configure Node Exporter to collect Linux system metrics like CPU
load and disk I/O. Node Exporter will expose these as Prometheus-style metrics.
Since the installation process is very similar, I’m not going to cover as deep
as Prometheus.
First, let’s create a
system user for Node Exporter by running the following command
sudo useradd \
    --system \
    --no-create-home \
    --shell /bin/false node_exporter
Use the wget command to download the binary.
wget https://github.com/prometheus/node_exporter/releases/download/v1.6.1/node_exporter-1.6.1.linux-amd64.tar.gz
Extract the node exporter from the archive.
tar -xvf node_exporter-1.6.1.linux-amd64.tar.gz
Move binary to the /usr/local/bin.
sudo mv \
  node_exporter-1.6.1.linux-amd64/node_exporter \
  /usr/local/bin/
Clean up, and delete node_exporter archive and a folder.
rm -rf node_exporter*
Verify that you can run the binary.
node_exporter --version
Next, create a similar systemd unit file.
sudo vim /etc/systemd/system/node_exporter.service
node_exporter.service
[Unit]
Description=Node Exporter
Wants=network-online.target
After=network-online.target
StartLimitIntervalSec=500
StartLimitBurst=5

[Service]
User=node_exporter
Group=node_exporter
Type=simple
Restart=on-failure
RestartSec=5s
ExecStart=/usr/local/bin/node_exporter \
    --collector.logind

[Install]
WantedBy=multi-user.target
Replace Prometheus user and
group to node_exporter, and update the ExecStart command.

To automatically start the
Node Exporter after reboot, enable the service.
sudo systemctl enable node_exporter
Then start the Node Exporter.
sudo systemctl start node_exporter
At this point, we have only a single target in our Prometheus.
To create astatic target, you need to add job_name with
static_configs.
sudo vim /etc/prometheus/prometheus.yml
prometheus.yml
- job_name: node_export
  static_configs:
    - targets: ["localhost:9100"]
By default, Node Exporter will be exposed on port 9100.
Before, restarting check if the config is valid.
promtool check config /etc/prometheus/prometheus.yml
Then, you can use a POST request to reload the config.
curl -X POST http://localhost:9090/-/reload
Check the targets section
http://<ip>:9090/targets
Install Grafana on Ubuntu 22.04

To visualize metrics we can use Grafana. There are many different data sources that Grafana supports, one of them is Prometheus. First, let’s make sure that all the dependencies are installed.
sudo apt-get install -y apt-transport-https software-properties-common
Next, add the GPG key.
wget -q -O - https://packages.grafana.com/gpg.key | sudo apt-key add -
echo "deb https://packages.grafana.com/oss/deb stable main" | sudo tee -a /etc/apt/sources.list.d/grafana.list
After you add the repository, update and install Garafana.
sudo apt-get update
sudo apt-get -y install grafana
sudo systemctl enable grafana-server
sudo systemctl start grafana-server
sudo systemctl status grafana-server
Go to http://<ip>:3000 and log in to the Grafana using default credentials.
The username is admin, and the password is admin as well.
username admin
password admin
To visualize metrics, youneed to add a data source first.
Click Add data source and select Prometheus.
For the URL, enter localhost:9090 and click Save and test. You can see Data source is working.
<public-ip:9090>
Let’s add Dashboard for a better view
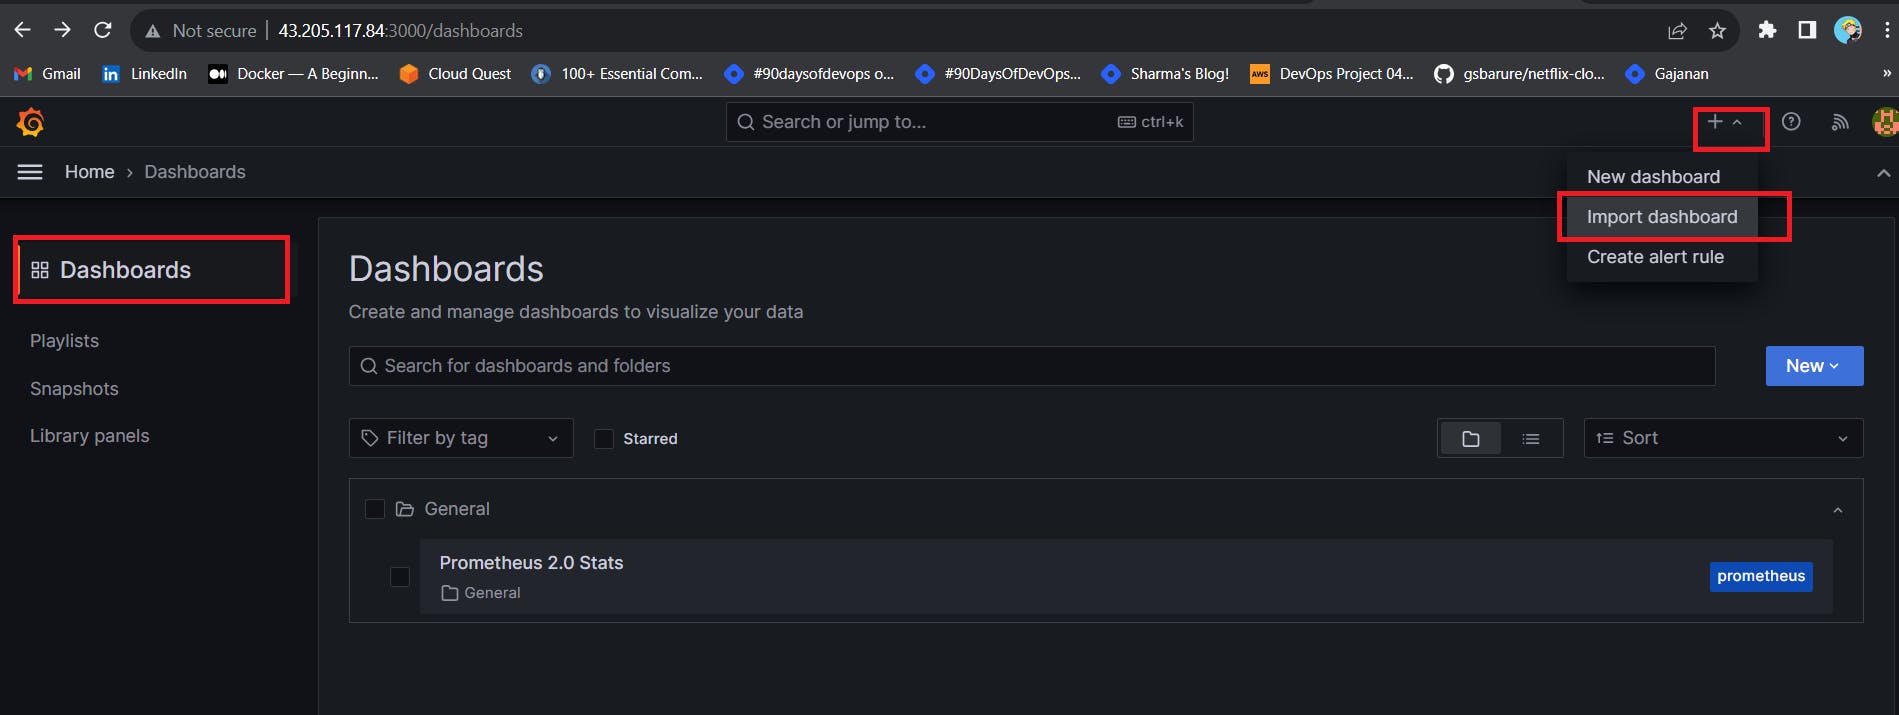
Click on Import Dashboard paste this code 1860 and click on load
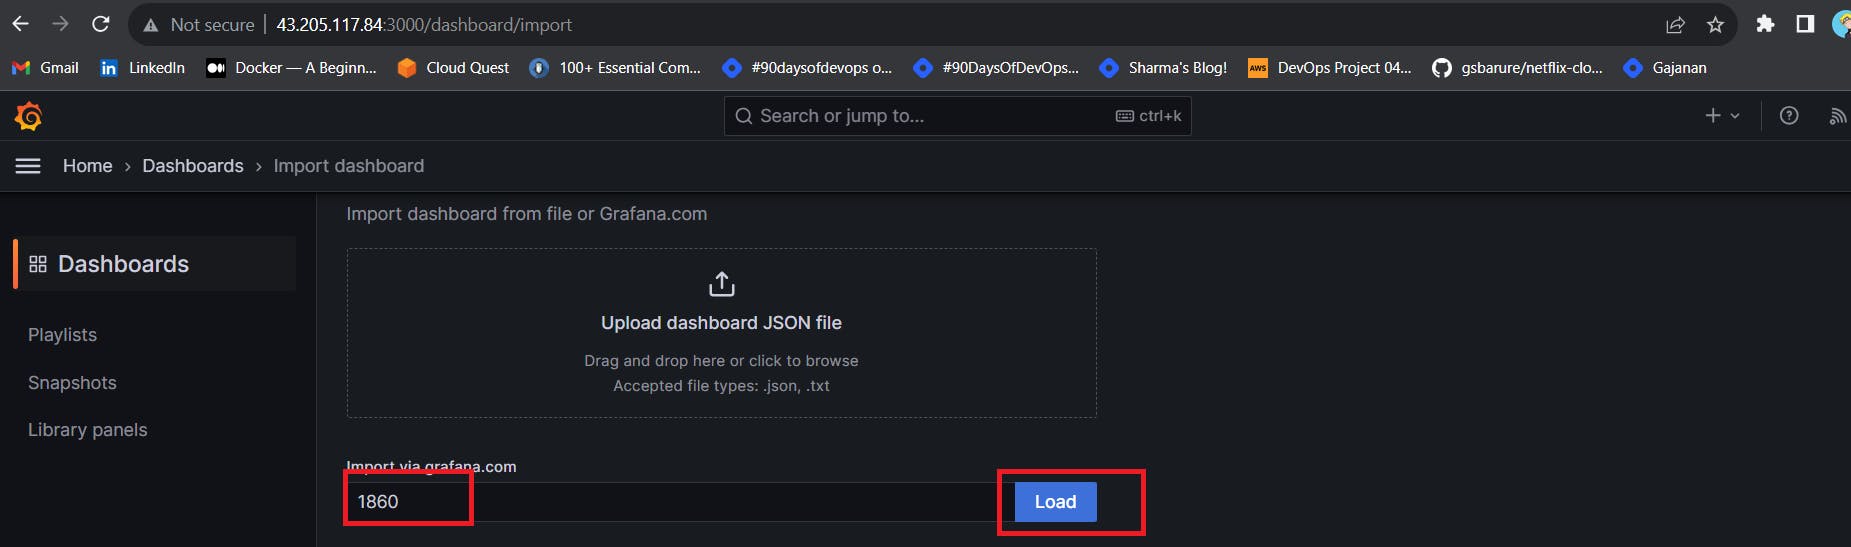
Select the Datasource and click on Import
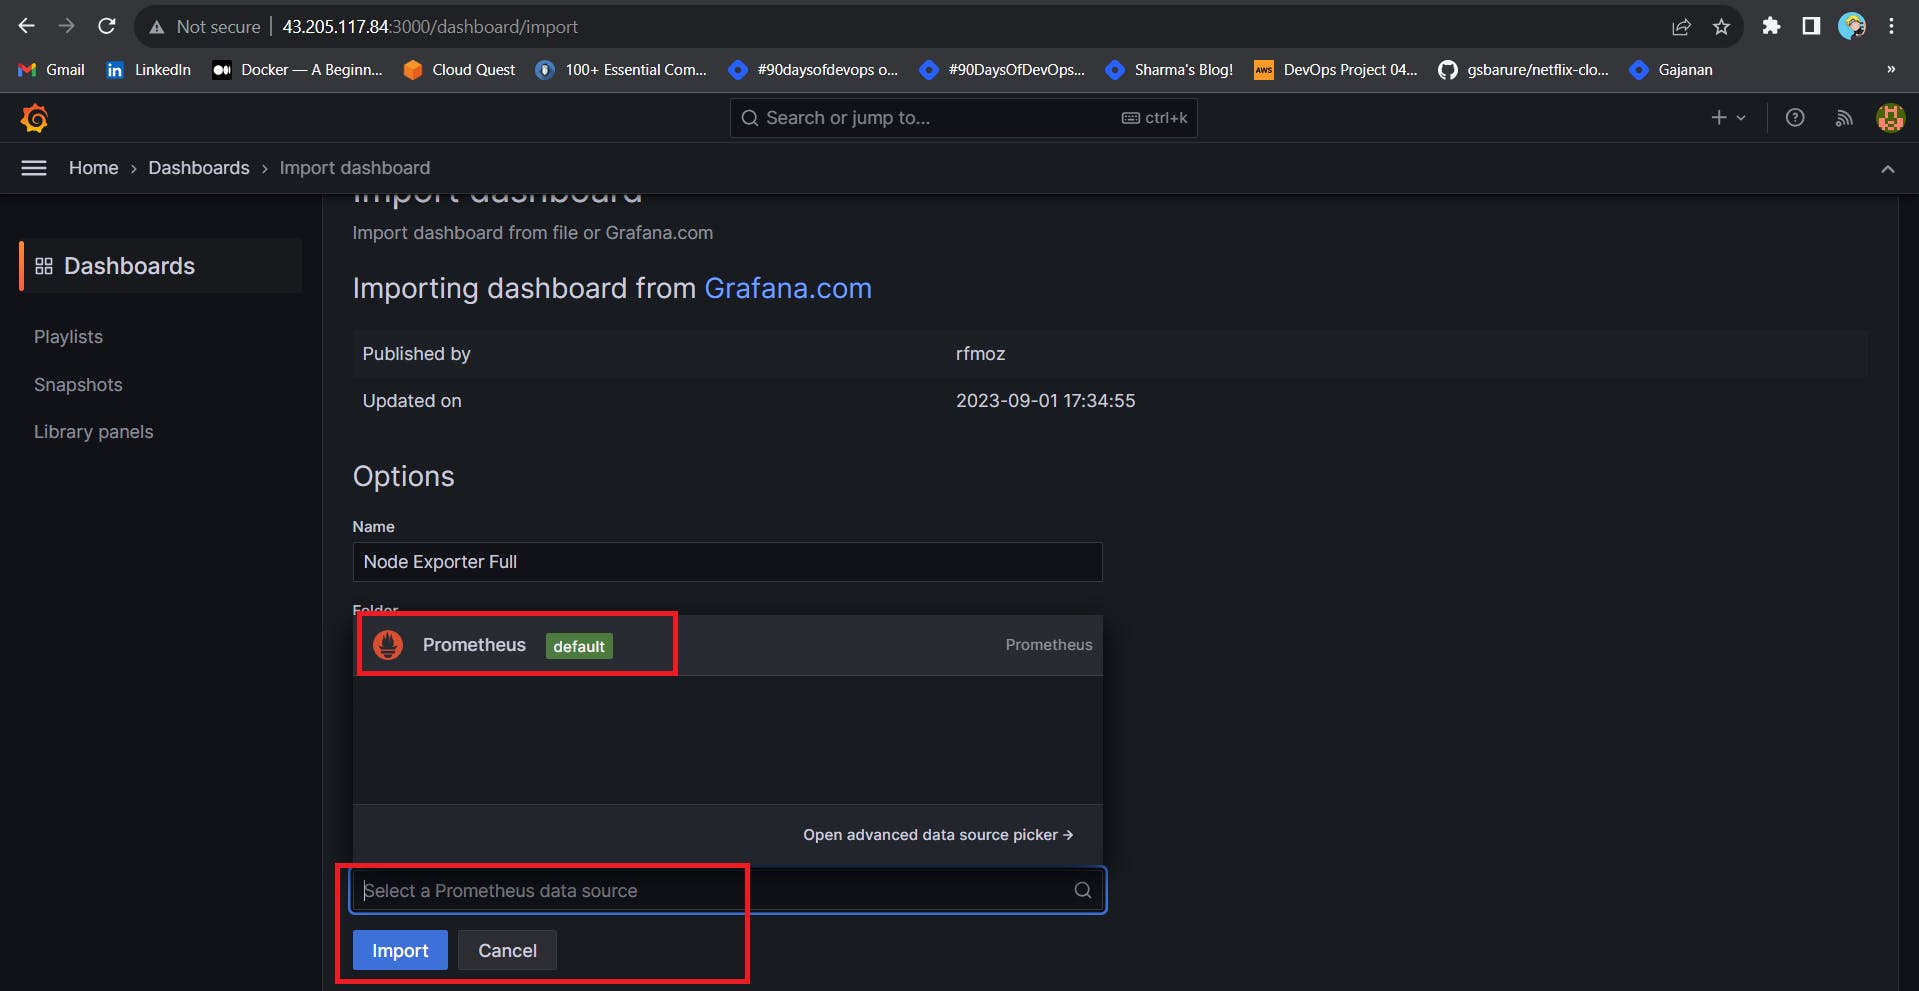
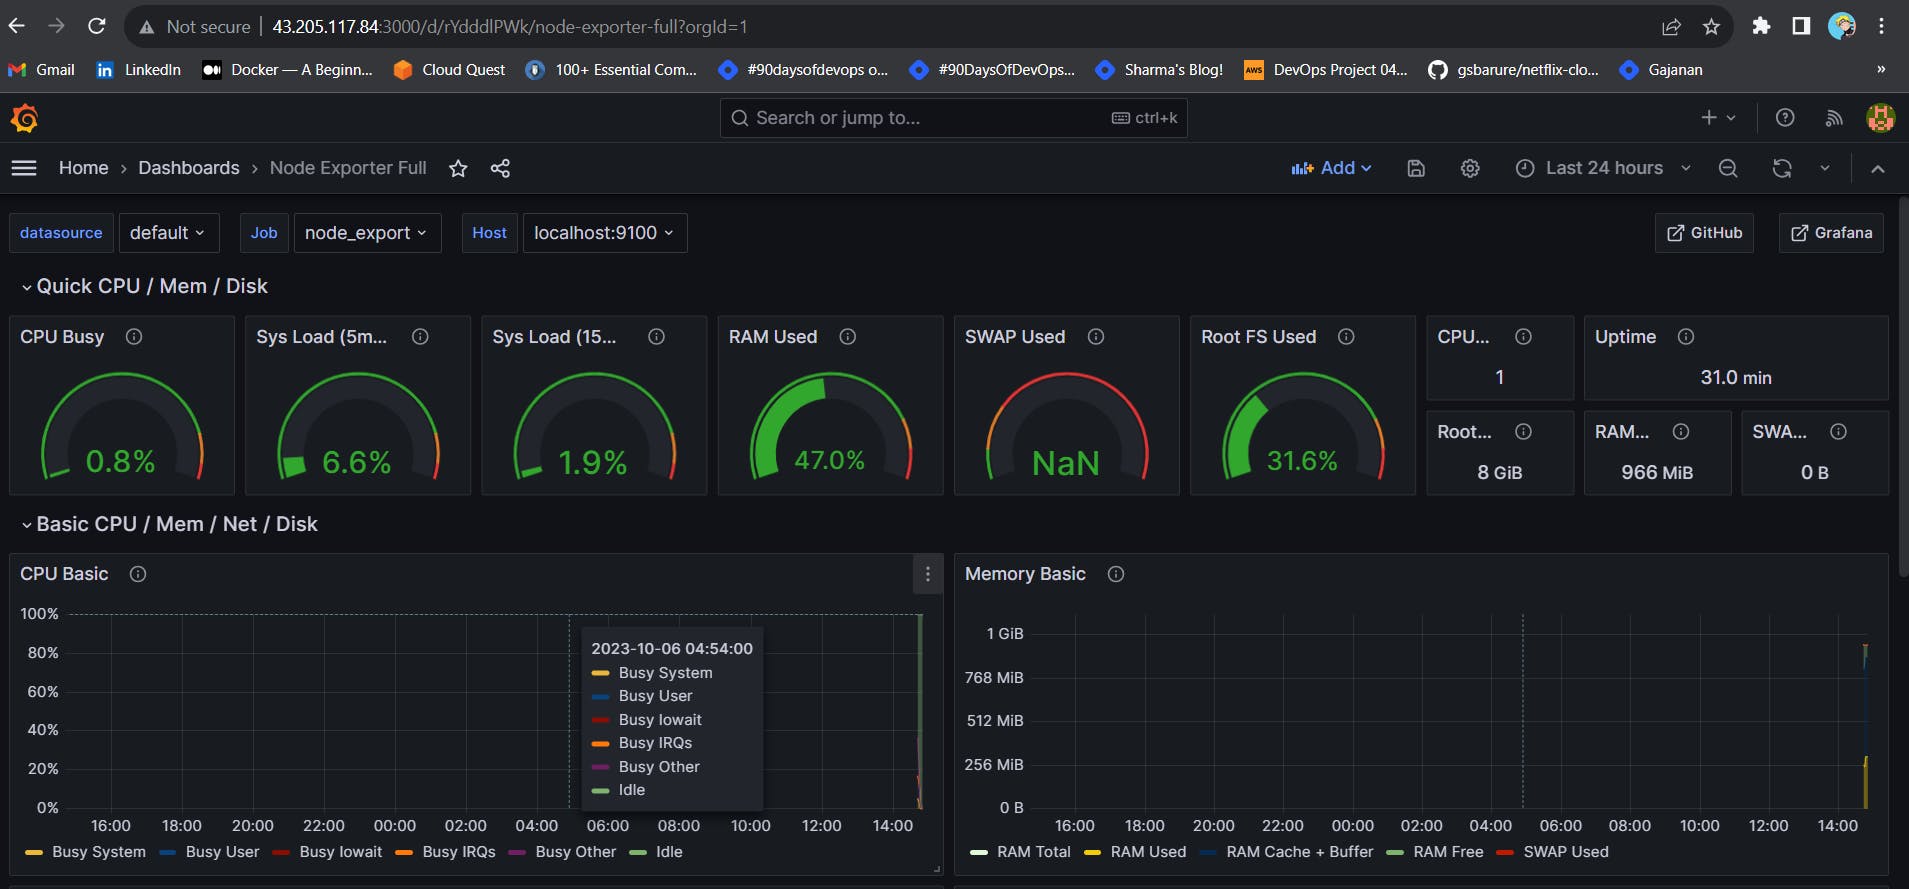
You will see this output
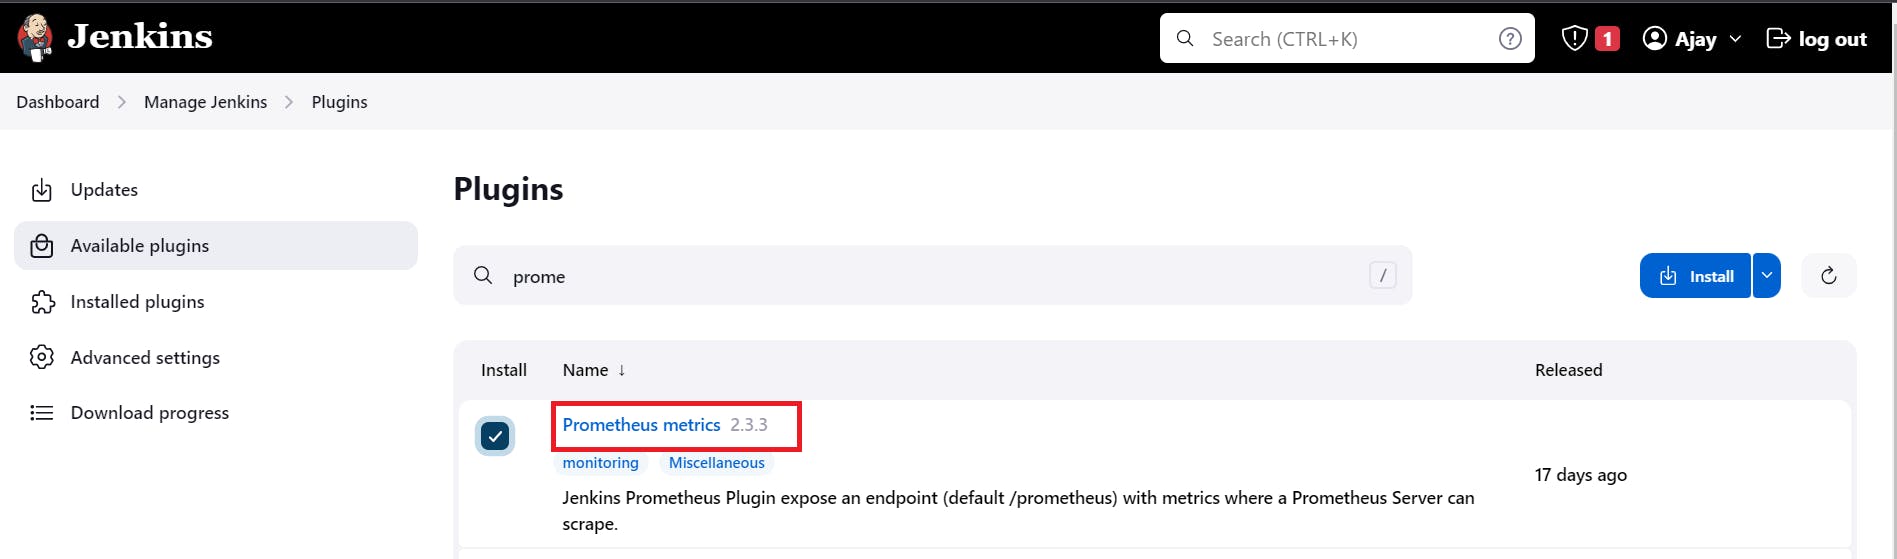
Step 5 — Install the Prometheus Plugin and Integrate it with the Prometheus server
Let’s Monitor JENKINS SYSTEM
Need Jenkins up and running machine
Goto Manage Jenkins –> Plugins –> Available Plugins
Search for Prometheus and install it
Once that is done you will Prometheus is set to /Prometheus path in system configurations
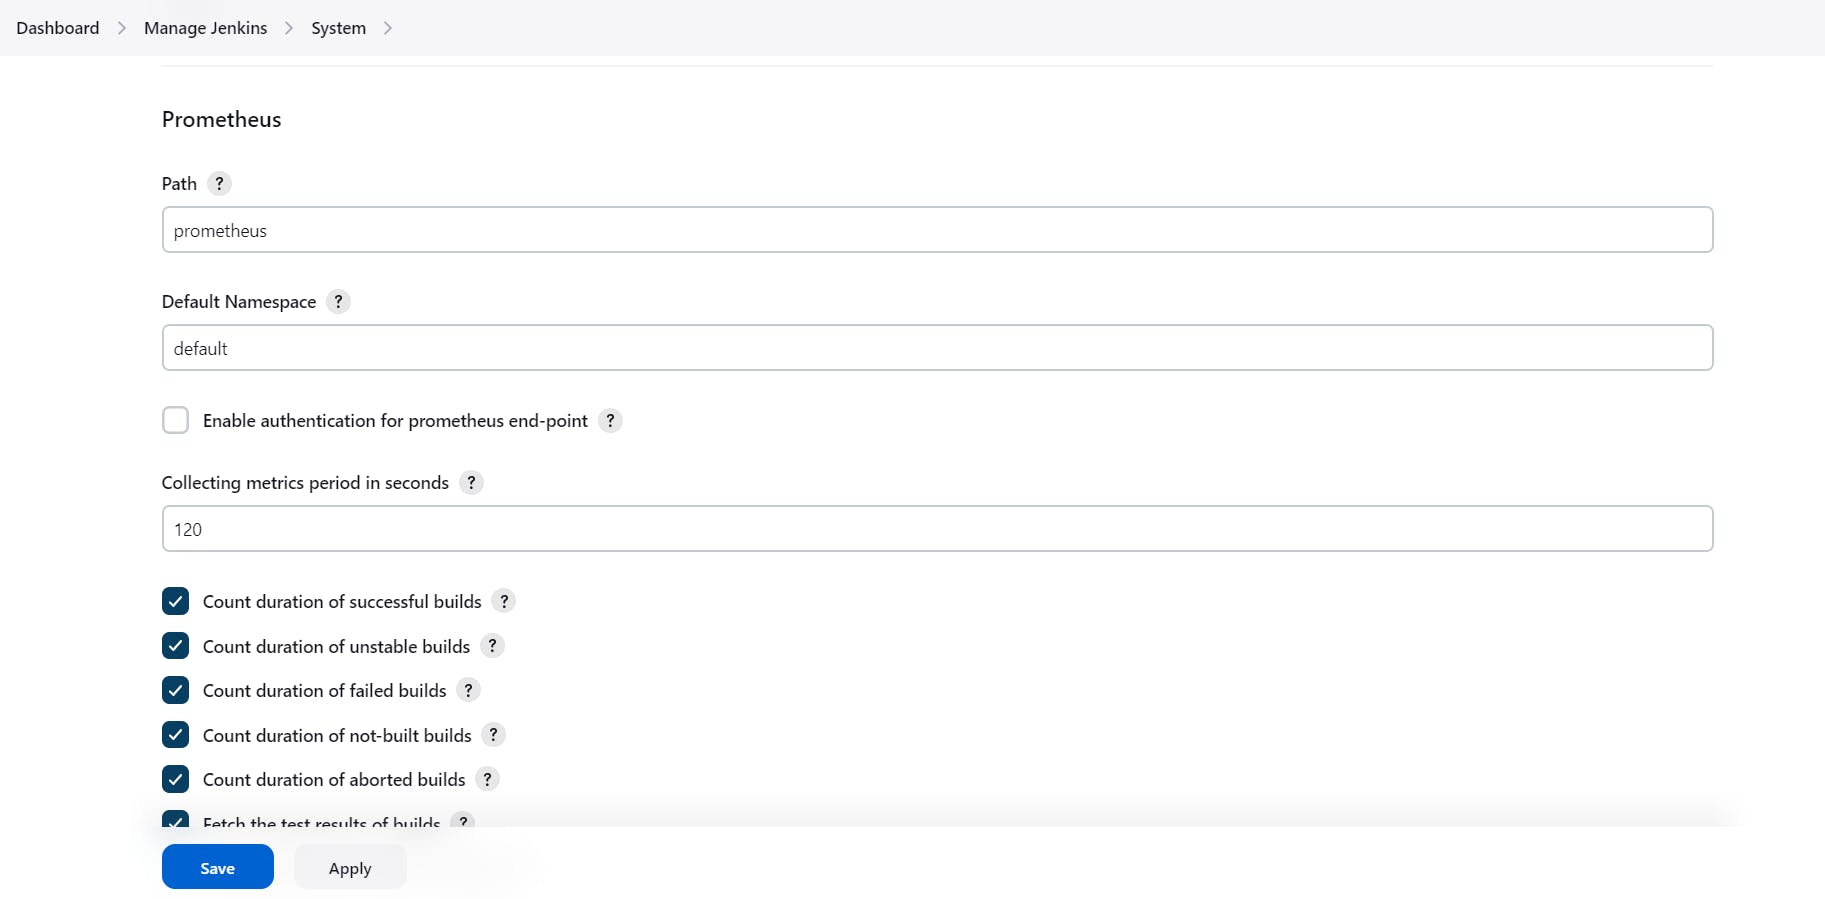
Nothing to change click on apply and save
To create a static target, you need to add job_name with static_configs. go to Prometheus server
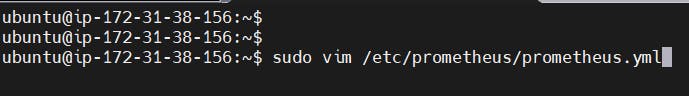
sudo vim /etc/prometheus/prometheus.yml
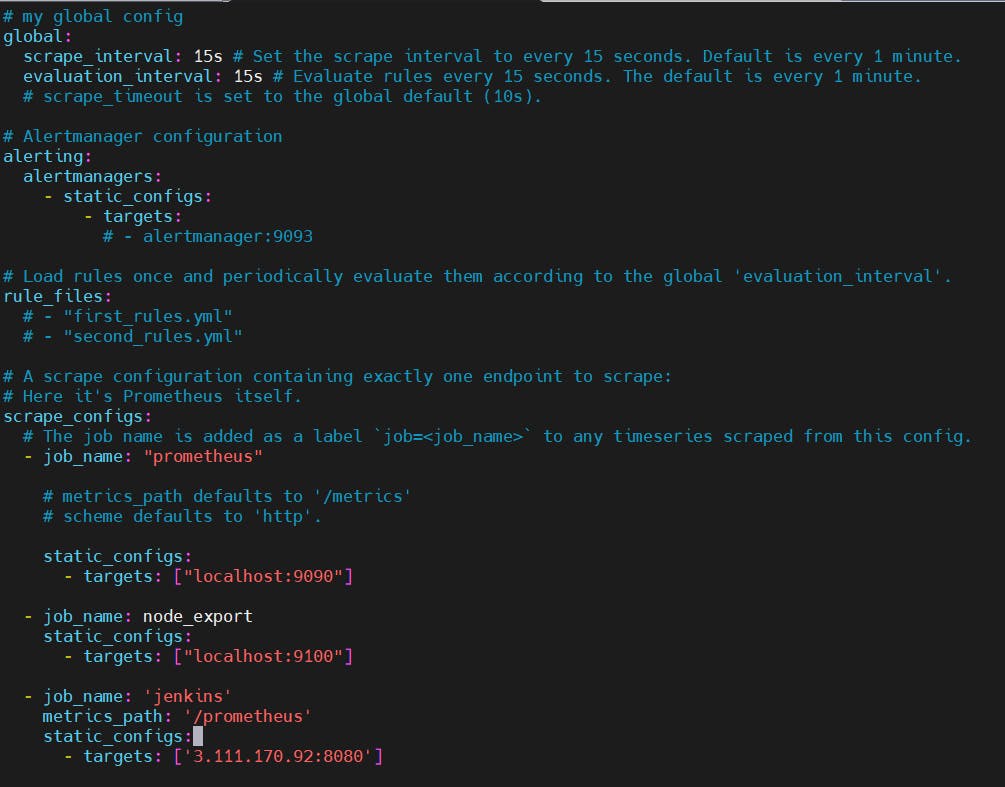
Paste below code
- job_name: 'jenkins'
metrics_path: '/prometheus'
static_configs:
- targets: ['<jenkins-ip>:8080']
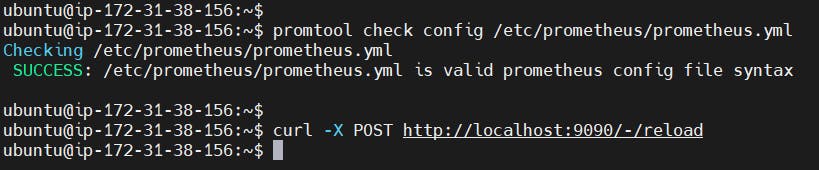
Before, restarting check if the config is valid.
promtool check config /etc/prometheus/prometheus.yml
Then, you can use a POST request to reload the config.
curl -X POST http://localhost:9090/-/reload
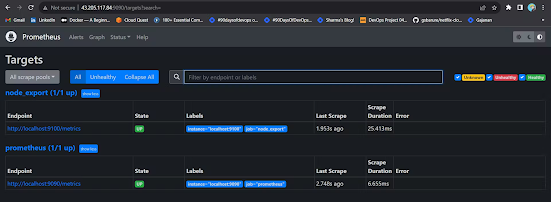
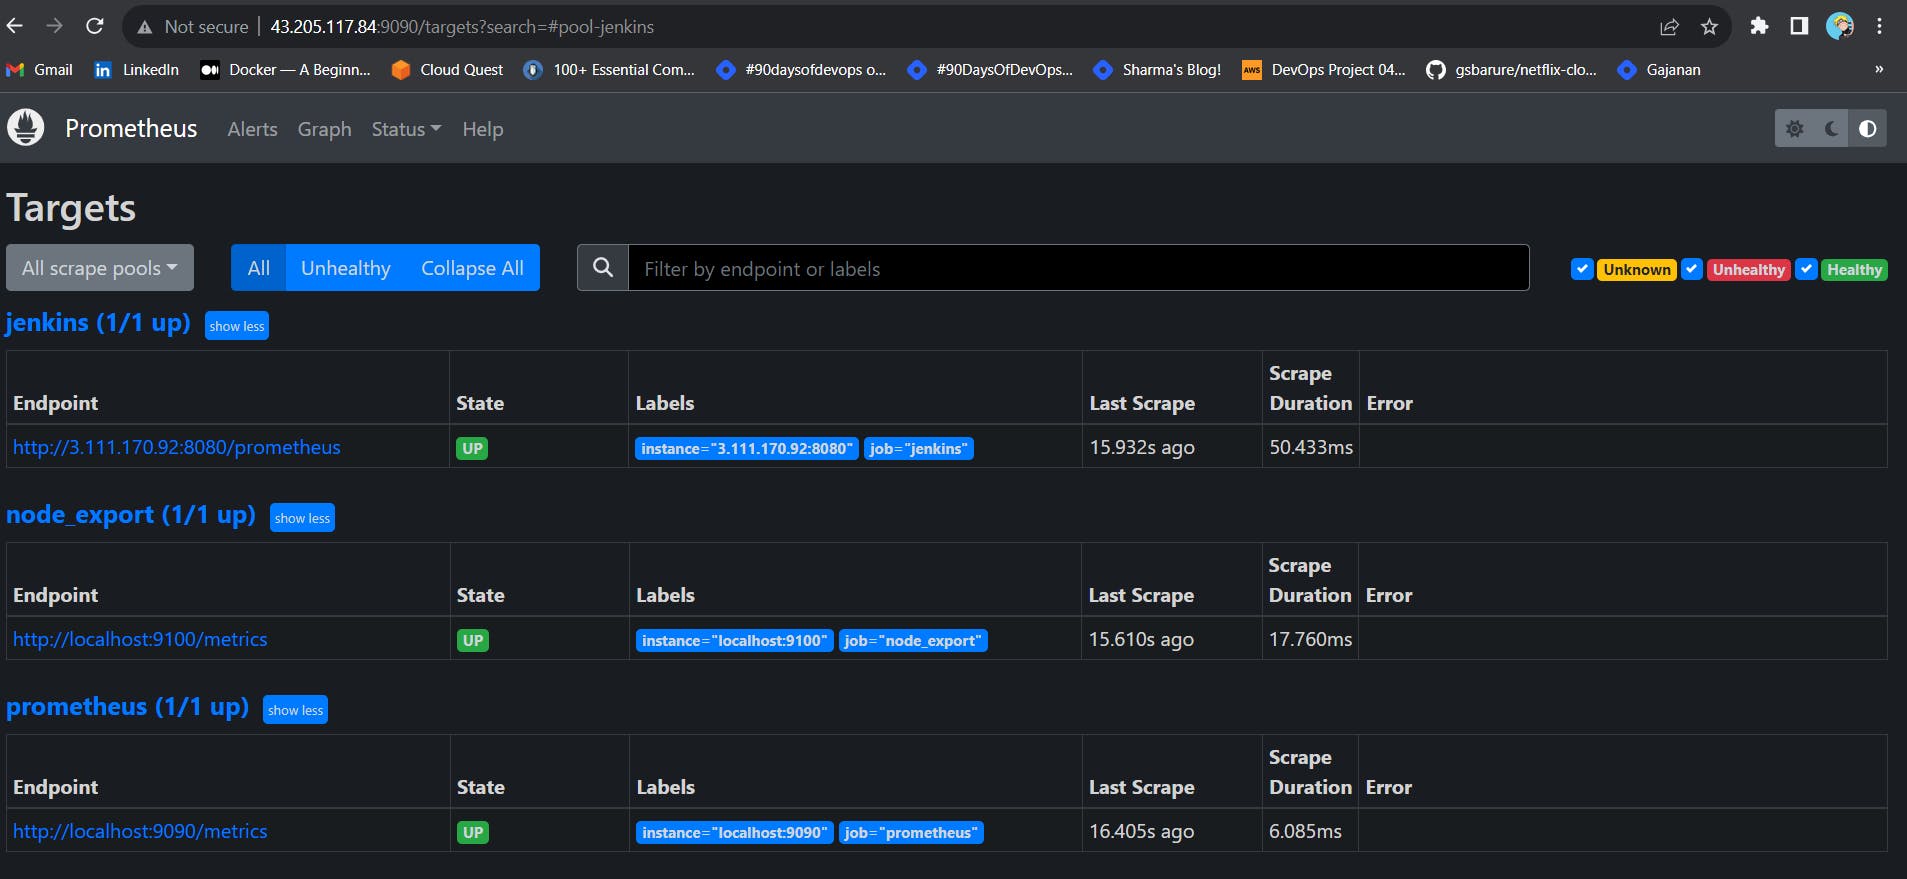
Check the targets section
You will see Jenkins is added to it
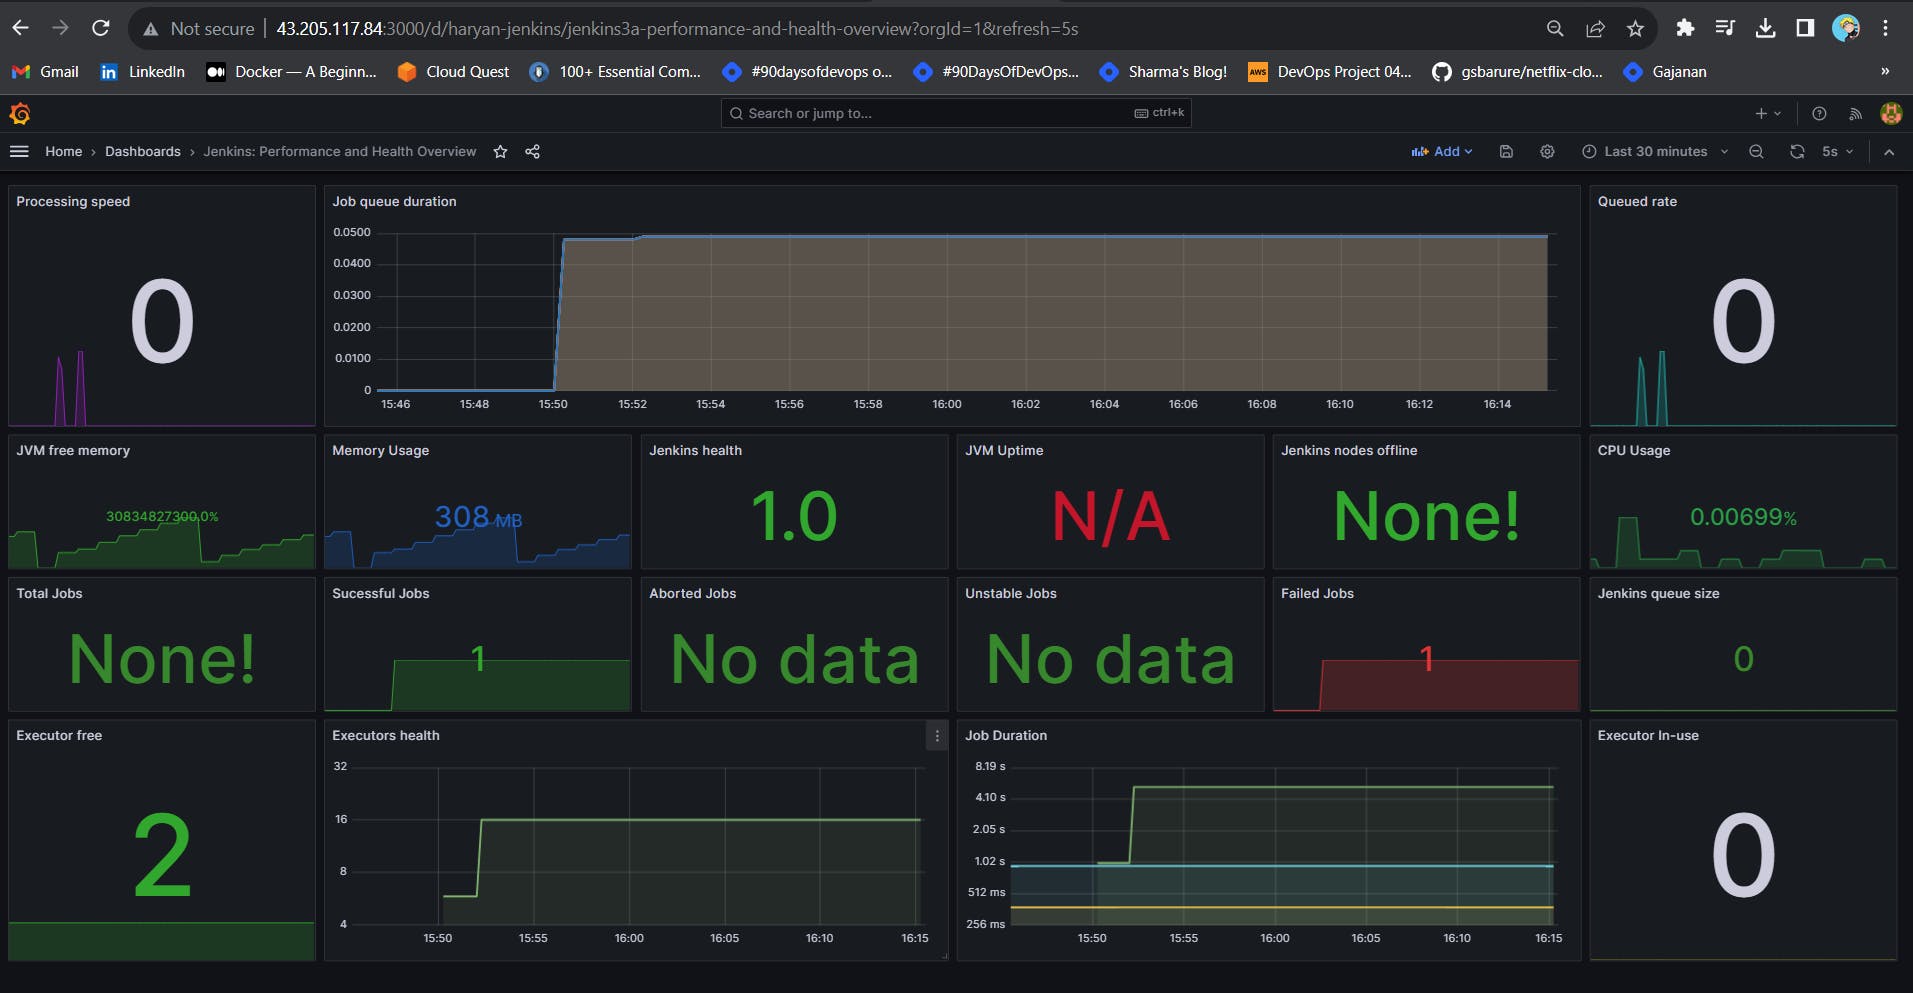
Let’s add Dashboard for a better view in Grafana
Click On Dashboard –> + symbol –> Import Dashboard
Use Id 9964 and click on load
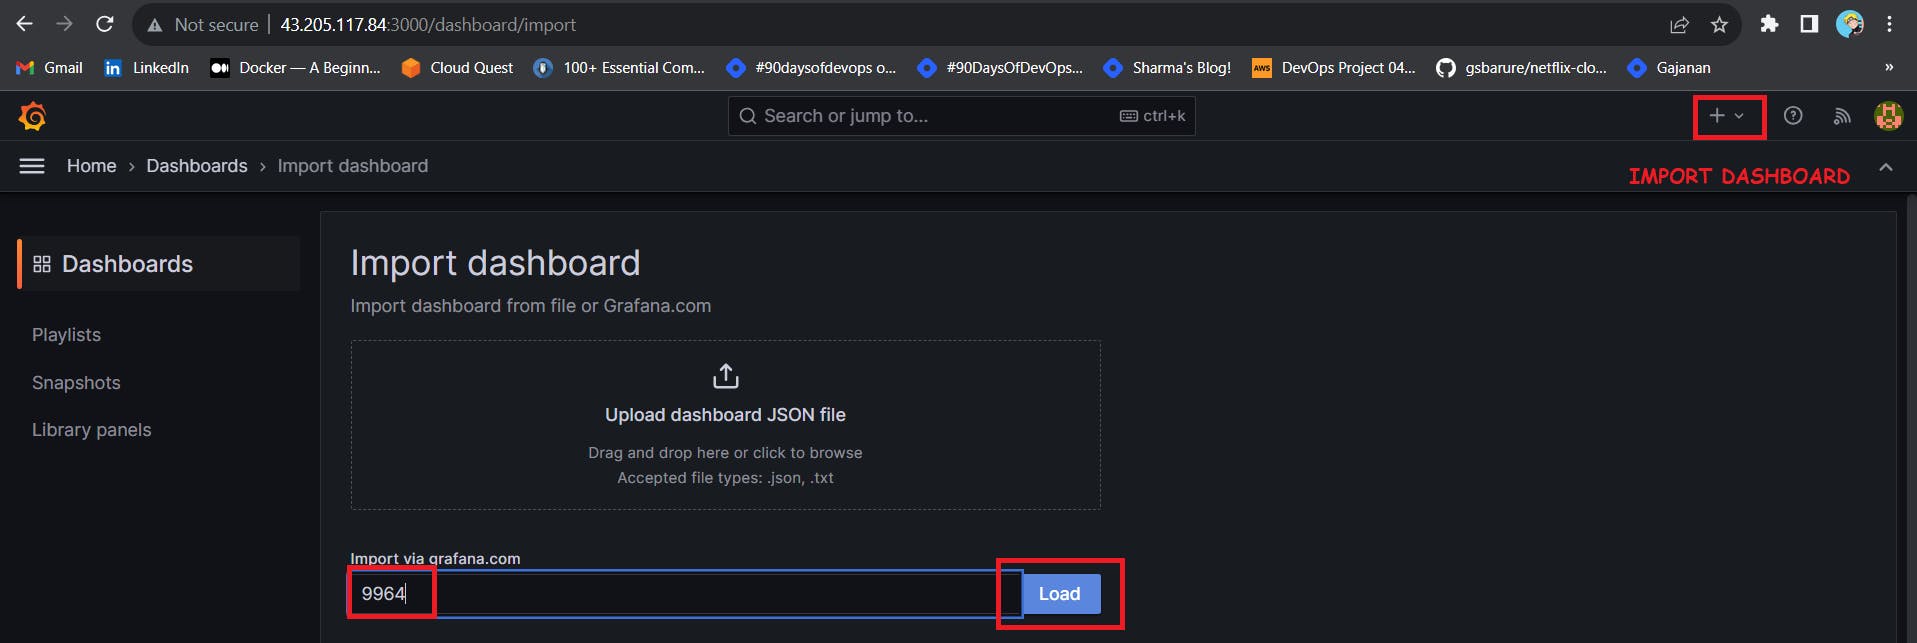
Select the data source and click on Import
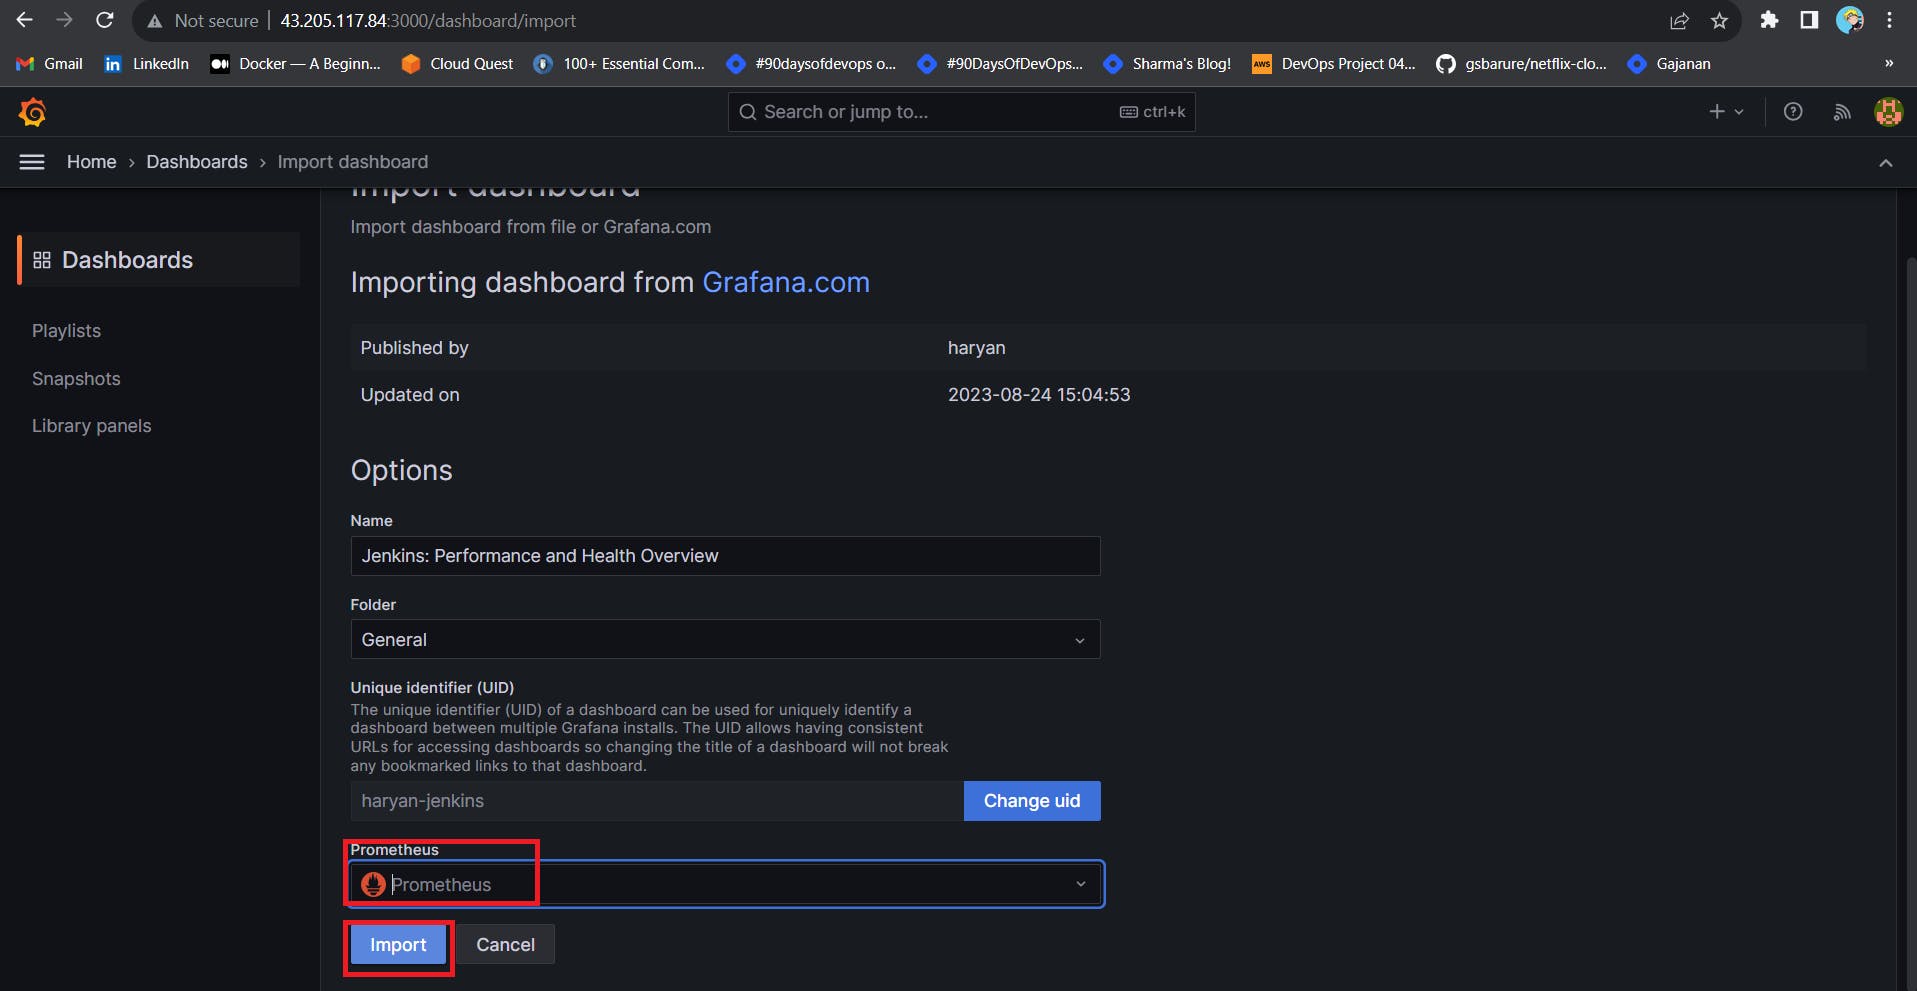
Now you will see the Detailed overview of Jenkins